

Python for AI & ML - Day 13: Introduction to Pandas DataFrames

Goal: Master Pandas DataFrames, the cornerstone of data manipulation and analysis in Python. Learn how to create, explore, and manipulate tabular data efficiently for AI/ML workflows.
1. What is a DataFrame?
A DataFrame is a 2-dimensional, labeled data structure with columns of potentially different data types (similar to a spreadsheet or SQL table). It is optimized for fast data operations and integrates seamlessly with NumPy and visualization libraries.
Key Features:
Rows and Columns: Rows represent records (e.g., a data sample), columns represent features (e.g., attributes).
Indexing: Row and column labels for easy data access.
Heterogeneous Data: Columns can hold integers, floats, strings, dates, etc.
Missing Data Support: Handles
NaN(Not a Number) values gracefully.
2. Creating DataFrames
From Dictionaries
import pandas as pd

# Dictionary with lists as values
data = {
    "Name": ["Alice", "Bob", "Charlie"],
    "Age": [25, 30, 35],
    "City": ["New York", "Paris", "London"]
}

df = pd.DataFrame(data) Output:
NameAgeCity0Alice25New York1Bob30Paris2Charlie35London
From Lists of Lists
data = [
    ["Alice", 25, "New York"],
    ["Bob", 30, "Paris"],
    ["Charlie", 35, "London"]
]
df = pd.DataFrame(data, columns=["Name", "Age", "City"])
From CSV/Excel Files
# Read CSV
df = pd.read_csv("data.csv")
# Read Excel
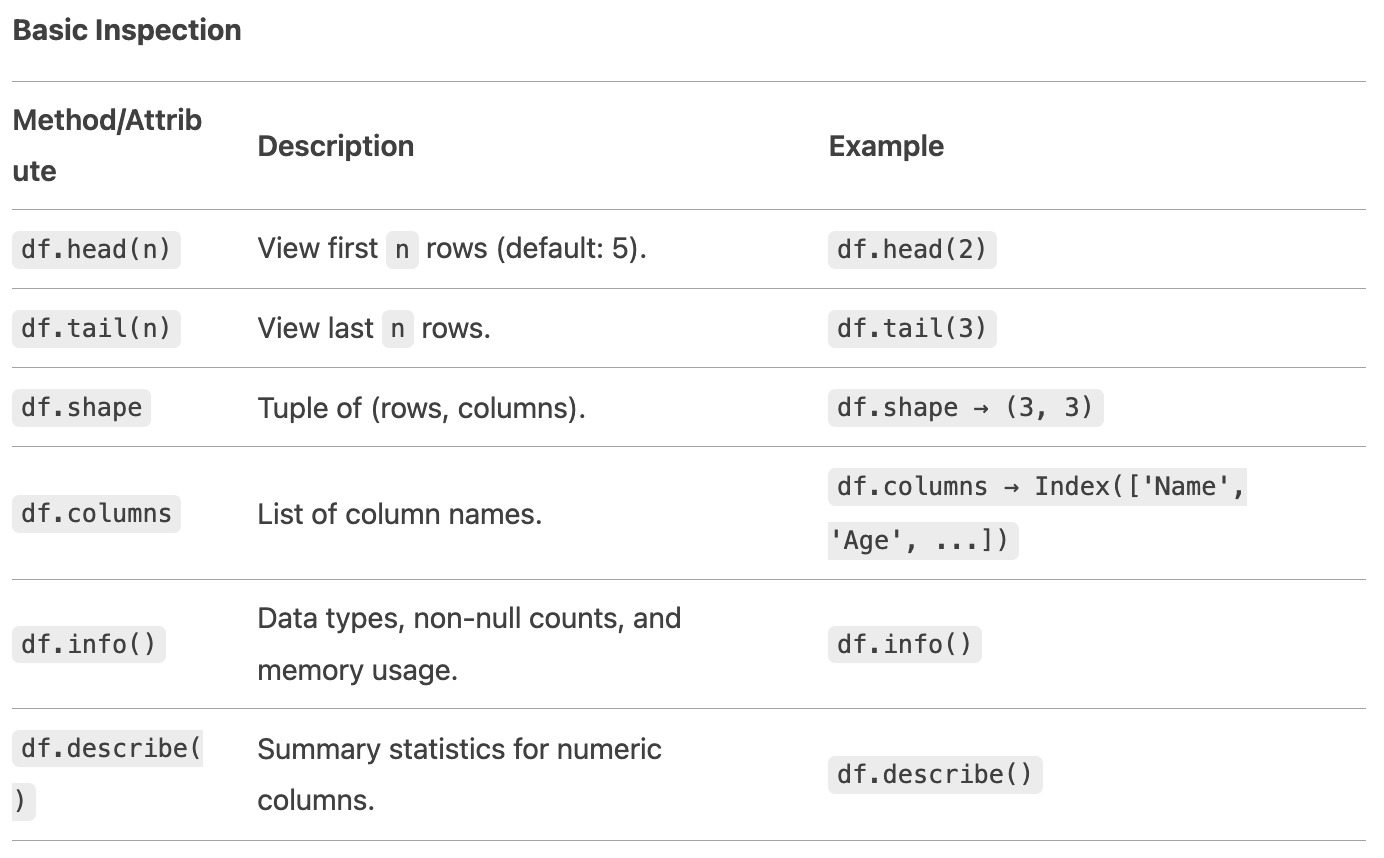
df = pd.read_excel("data.xlsx", sheet_name="Sheet1") 3. Exploring DataFrames
Basic Inspection
4. Accessing Data
Columns
# Get a column as a Series
ages = df["Age"]

# Get multiple columns as a DataFrame
subset = df[["Name", "City"]]
Rows
By Index:
# Using .loc (label-based)
row_1 = df.loc[1]  # Row with index label 1

# Using .iloc (position-based)
row_1 = df.iloc[1]  # Second row (0-based)
Filtering Rows:
# Filter rows where Age > 30
older = df[df["Age"] > 30]

# Combine conditions with & (and), | (or)
ny_residents = df[(df["City"] == "New York") & (df["Age"] < 30)]
5. Modifying Data
Add/Remove Columns
# Add a column
df["Salary"] = [70000, 80000, 90000]

# Remove a column
df = df.drop("Salary", axis=1)  # axis=1 for columns
Rename Columns
df = df.rename(columns={"City": "Location"}) Handle Missing Data
# Drop rows with missing values
df_clean = df.dropna()

# Fill missing values
df_filled = df.fillna(0)  # Replace NaNs with 0
df_filled = df.fillna(df.mean())  # Fill with column mean
6. Data Manipulation
Sorting
# Sort by Age (ascending)
df_sorted = df.sort_values("Age")

# Sort by City (descending)
df_sorted = df.sort_values("City", ascending=False)
Grouping and Aggregation
# Group by City and calculate mean Age
grouped = df.groupby("City")["Age"].mean()
Apply Functions
# Convert Name to uppercase
df["Name"] = df["Name"].apply(lambda x: x.upper())

# Vectorized operations (faster than apply)
df["Age_next_year"] = df["Age"] + 1
7. Merging DataFrames
Combine DataFrames like SQL joins:
df1 = pd.DataFrame({"ID": [1, 2], "Value": [10, 20]})
df2 = pd.DataFrame({"ID": [2, 3], "Value": [30, 40]})

# Inner join
merged = pd.merge(df1, df2, on="ID", how="inner")
8. Use Cases in AI/ML
Data Loading: Import CSV/Excel datasets.
Feature Engineering: Create new columns (e.g.,
BMI = weight / height²).Data Cleaning: Handle missing values, outliers.
Exploratory Data Analysis (EDA): Visualize trends with Pandas + Matplotlib/Seaborn.
9. Performance Tips
Vectorization: Avoid loops; use built-in Pandas/NumPy operations.
Use Proper Data Types: Convert columns to
categoryfor low-cardinality data.Avoid Chained Indexing: Use
.locor.ilocinstead ofdf[df.Age > 30]["Name"](usedf.loc[df.Age > 30, "Name"]).
10. Practice Exercise
Load the Titanic dataset (
pd.read_csv("titanic.csv")).Explore the first 5 rows and summary statistics.
Create a new column
FamilySize=SibSp + Parch + 1.Filter passengers older than 30 and group by
Pclassto find average fare.
Solution:
# 1. Load data
titanic = pd.read_csv("titanic.csv")

# 2. Explore
print(titanic.head())
print(titanic.describe())

# 3. Add FamilySize
titanic["FamilySize"] = titanic["SibSp"] + titanic["Parch"] + 1

# 4. Filter and group
older_passengers = titanic[titanic["Age"] > 30]
avg_fare = older_passengers.groupby("Pclass")["Fare"].mean()
Key Takeaways
DataFrames are the backbone of data manipulation in Python.
Use
.loc/.ilocfor row/column access andgroupbyfor aggregations.Optimize performance with vectorized operations and proper data types.